Car Access Around Beeston, Chilwell and Stapleford: A Ward-Level Census Guide
Census 2021 household figures reveal substantial differences between ten selected wards, with counts, comparable percentages and clear limits on what they tell us about NG9.
Published
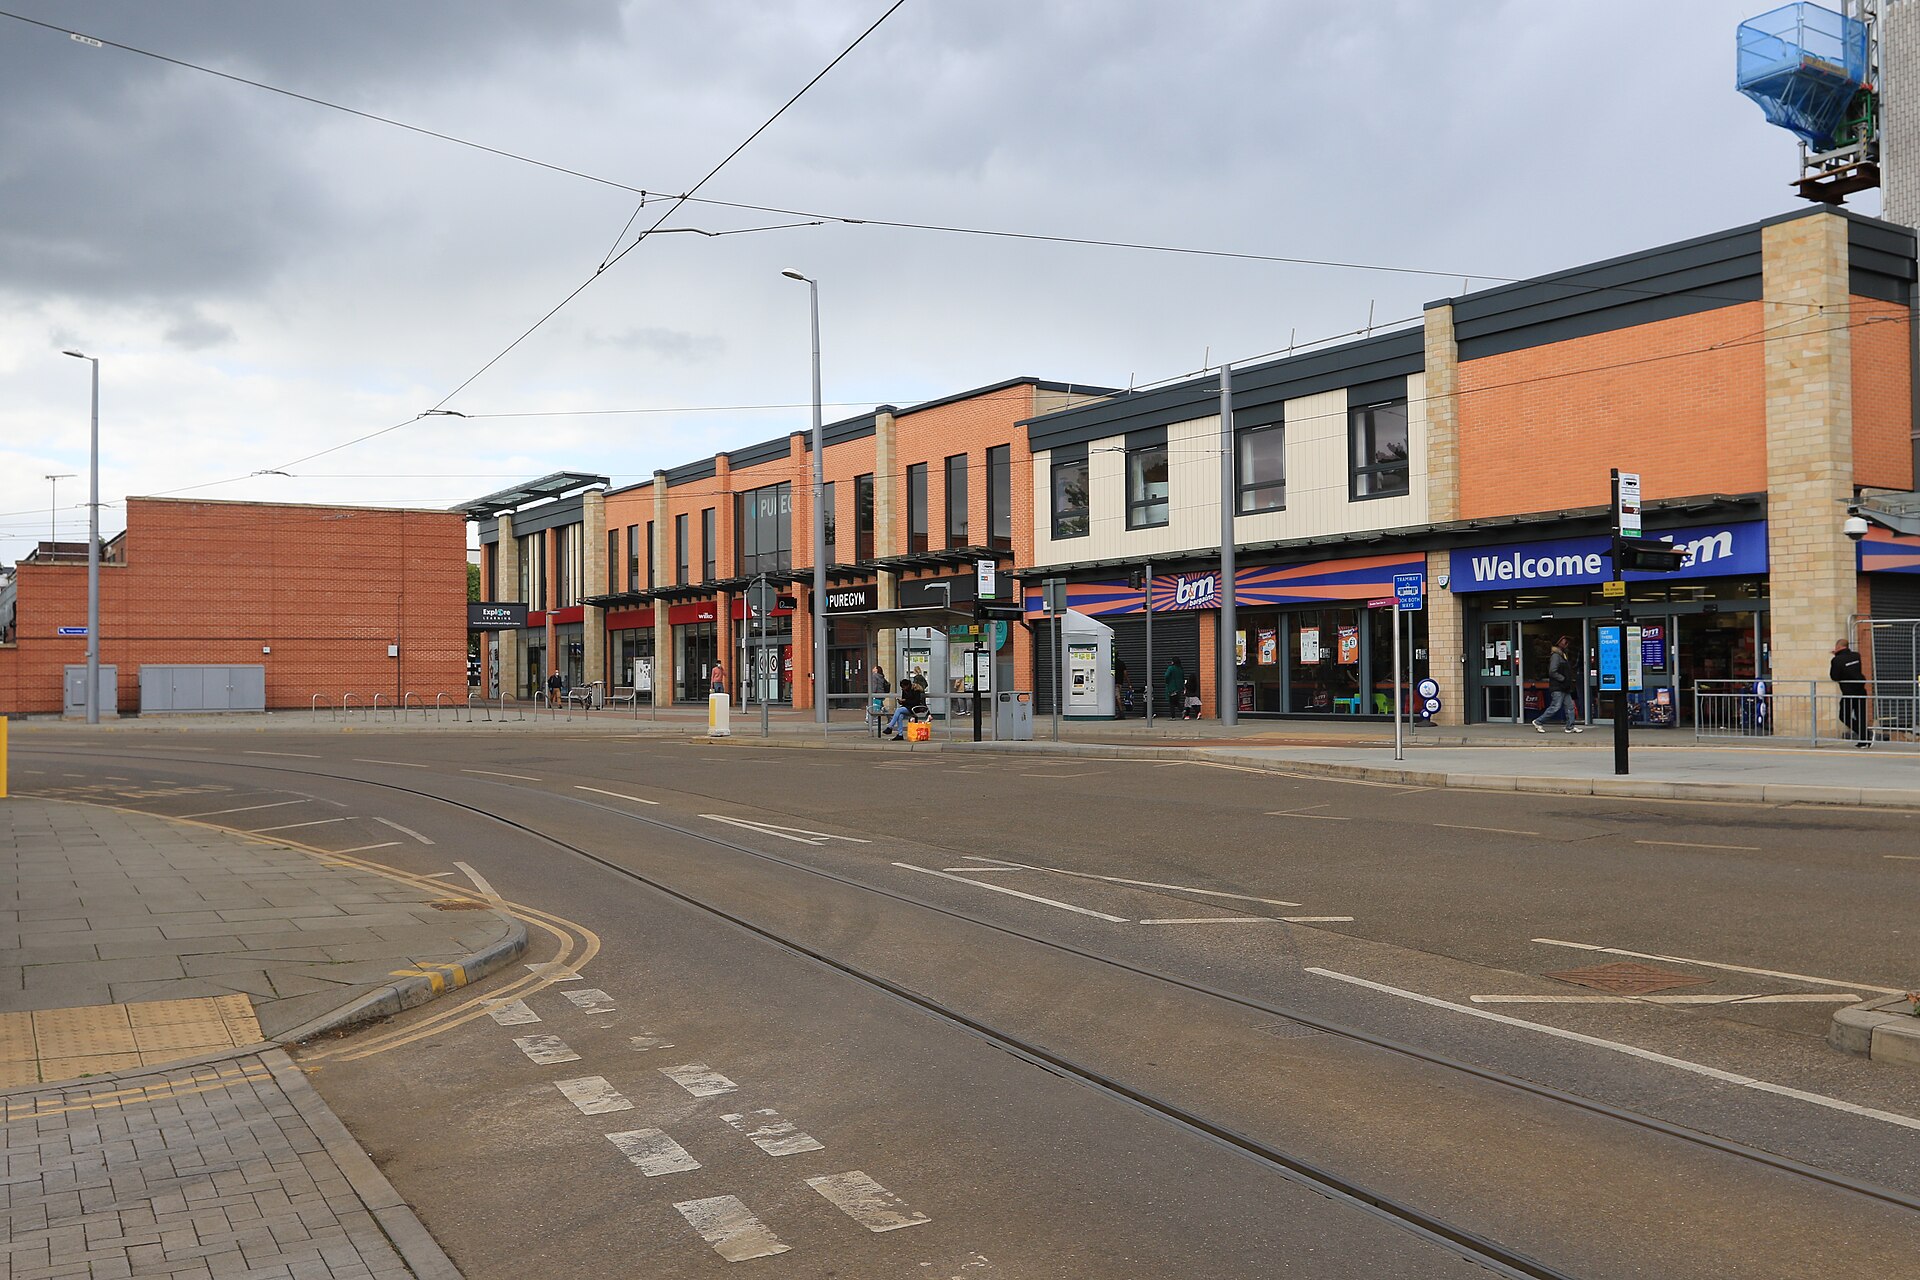

Car access varied sharply between the wards around Beeston, Chilwell and Stapleford in Census 2021. Beeston Central recorded no car or van in 41.1% of households, compared with 11.6% in Toton and Chilwell Meadows. These figures describe household vehicle availability on 21 March 2021, reported on 2022 ward boundaries.[1][4]
The Ward-by-Ward Picture
Each number below counts households. The vehicle columns show how many households had none, one, two, or three or more cars or vans available. The final column converts the no-car count into a percentage of all households in that ward, allowing comparisons between wards of different sizes. All observations are from Census 2021 on 2022 ward boundaries.[4]
| Ward and Geography Code | All Households | No Cars or Vans | One | Two | Three or More | No-Car Share |
|---|---|---|---|---|---|---|
| Attenborough and Chilwell East, E05010514 | 3,064 | 493 | 1,418 | 899 | 254 | 16.1% |
| Beeston Central, E05010516 | 2,746 | 1,128 | 1,158 | 353 | 107 | 41.1% |
| Beeston North, E05010517 | 2,372 | 637 | 1,095 | 510 | 130 | 26.9% |
| Beeston Rylands, E05010518 | 2,274 | 596 | 1,065 | 497 | 116 | 26.2% |
| Beeston West, E05010519 | 2,451 | 584 | 1,171 | 579 | 117 | 23.8% |
| Chilwell West, E05010522 | 3,357 | 851 | 1,544 | 762 | 200 | 25.4% |
| Stapleford North, E05010529 | 2,163 | 498 | 991 | 531 | 143 | 23.0% |
| Stapleford South East, E05010530 | 2,309 | 481 | 948 | 668 | 212 | 20.8% |
| Stapleford South West, E05010531 | 2,435 | 528 | 1,208 | 569 | 130 | 21.7% |
| Toton and Chilwell Meadows, E05010532 | 3,395 | 394 | 1,445 | 1,184 | 372 | 11.6% |
Beeston Central Stands Apart
Among these ten wards, Beeston Central had the highest no-car share in 2021. Its 1,128 households without a car or van were almost as numerous as its 1,158 households with one. Elsewhere in Beeston, the no-car proportions were lower: 26.9% in Beeston North, 26.2% in Beeston Rylands and 23.8% in Beeston West.[4]
The opposite end of the comparison also deserves attention. Toton and Chilwell Meadows had 1,184 households with two cars or vans and another 372 with three or more. Together, those categories accounted for 45.8% of its households. In Beeston Central, the equivalent share was 16.8%. Both calculations describe the same Census date and use each ward’s own all-household denominator.[4]
Across the three selected Stapleford wards, the no-car share ranged from 20.8% in Stapleford South East to 23.0% in Stapleford North, with Stapleford South West at 21.7%. A single car or van was the largest individual category in every ward in the table.[4]
Counts and Percentages Answer Different Questions
Chilwell West illustrates why both measures matter. It recorded 851 households without a car or van in 2021, compared with 637 in Beeston North. Yet its no-car percentage was lower, at 25.4% against 26.9%, because Chilwell West had more households overall.[4]
For a discussion about the number of households potentially affected by a local decision, start with the count. To compare how widespread no-car availability was within each ward, use the percentage. Neither measure explains why those households had no vehicle or which journeys they needed to make.[1][4]
Why This Is Not an NG9 Postcode Total
The records identify electoral wards, with individual geography codes and a 2022 boundary vintage. Adding their figures would produce a total for this selection of wards. It would not establish a total for the NG9 postcode district.[4]
Broxtowe provides a separate district comparison. The Office for National Statistics, the official statistics body, identifies Broxtowe as a non-metropolitan district in Nottinghamshire. Its ward list extends beyond the places in this table, including Eastwood Hall and Kimberley.[2]
Across Broxtowe district, code E07000172, Census 2021 recorded 9,609 households without a car or van out of 48,361 households, equivalent to 19.9%. That is district-level context on the dataset’s 2022 local authority geography. It should remain labelled Broxtowe whenever it is quoted.[3]
What Counts as an Available Car or Van?
The Census measure covers cars or vans owned or available for use by household members. Company vehicles count when available for private use, as do vehicles owned or used by a lodger. Pick-ups, camper vans and motor homes are included.[1]
Availability has a specific statistical meaning here. Vehicles temporarily not working or that have failed their MOT are included. Vehicles with a Statutory Off Road Notification are excluded, along with motorbikes, mobility scooters, visitors’ vehicles and vehicles kept elsewhere or not easily accessed.[1]
The unit remains the household throughout. A household recorded with one vehicle does not tell us how access was shared between its members. Equally, the no-car category cannot be read as a count of people without driving licences. Vehicles used by residents of communal establishments are outside this household measure.[1]
Calculation Method and Limits
The table uses the Census 2021 TS045 categories returned by Nomis, an ONS service, alongside the definitions in TS045 version 4. Each no-car percentage is the no-car household count divided by the same ward’s “Total: All households” value, multiplied by 100 and rounded to one decimal place. For example, Beeston Central’s calculation is 1,128 ÷ 2,746 × 100 = 41.1%. Two-or-more shares combine only the two-vehicle and three-or-more categories before dividing by that denominator.[1][2][4]
ONS applies disclosure protection, including small changes to some counts, so small differences between Census tables can occur. These observations also remain a snapshot of March 2021. When using them in a transport discussion or neighbourhood proposal, keep the observation year, full ward name, geography code and boundary vintage beside the figure, then establish what has changed since.[1][4]
Sources and checks
These sources were used for this article. Availability, prices and service details can change after the stated check date.
- Car or van availability
- Office for National Statistics
Checked 20 October 2026.
TS045 measures household car or van availability as at 21 March 2021. The measure includes specified private-use company vehicles, lodgers’ vehicles, camper vans and temporarily unroadworthy vehicles. The measure excludes SORN vehicles, motorbikes, mobility scooters, visitors’ vehicles and vehicles kept elsewhere or not easily accessed. The observations concern households rather than individual driving licences, individual access arrangements or communal establishment residents’ vehicles. Disclosure protection can cause small differences between tables.
- Broxtowe (E07000172) - ONS
Checked 20 October 2026.
ONS identifies Broxtowe as a non-metropolitan district in Nottinghamshire. Broxtowe’s ward list includes Eastwood Hall and Kimberley as well as the wards compared in the article. Nomis is an ONS service.
- TS045
Checked 20 October 2026.
For Census 2021 on the 2022 district geography, Broxtowe E07000172 recorded 48,361 households and 9,609 households without cars or vans. The derived Broxtowe no-car share is 9,609 divided by 48,361 multiplied by 100, rounded to one decimal place, giving 19.9%.
- Census 2021 selected NG9-area ward data
Checked 20 October 2026.
All ten table rows reproduce Census 2021 household counts for the exact named and coded 2022 wards, covering total households and the mutually exclusive zero, one, two and three-or-more vehicle categories. No-car percentages use each ward’s no-car count divided by its own all-household denominator, multiplied by 100 and rounded to one decimal place. The resulting no-car shares are 16.1%, 41.1%, 26.9%, 26.2%, 23.8%, 25.4%, 23.0%, 20.8%, 21.7% and 11.6% in table order. Beeston Central has the highest no-car share and Toton and Chilwell Meadows the lowest among these ten selected wards. Toton and Chilwell Meadows’ two-or-more share is (1,184 + 372) divided by 3,395 multiplied by 100, rounded to 45.8%. Beeston Central’s two-or-more share is (353 + 107) divided by 2,746 multiplied by 100, rounded to 16.8%. The three Stapleford wards’ no-car shares range from 20.8% to 23.0%. One car or van is the largest individual availability category in each selected ward. Chilwell West has a higher no-car household count than Beeston North but a lower no-car percentage. The records describe selected wards on 2022 boundaries, rather than a published NG9 postcode district total.